In an era where data has become the “universal language” of the world, understanding and knowing how to leverage data is no longer an advantage — it is the minimum requirement. Yet among countless tools, libraries, and machine-learning models emerging every day, one foundational skill has retained its power over time: <strong>statistics</strong>. Without statistics, every model is merely a blind experiment; without statistics, every number is just fragmented data without meaning.
The problem is that statistics is often seen as a dry and formula-heavy subject that is difficult to approach. Many people who begin learning Data Science struggle with the feeling of “not knowing what they actually need to understand,” or “not knowing where to start within this vast pool of knowledge.”
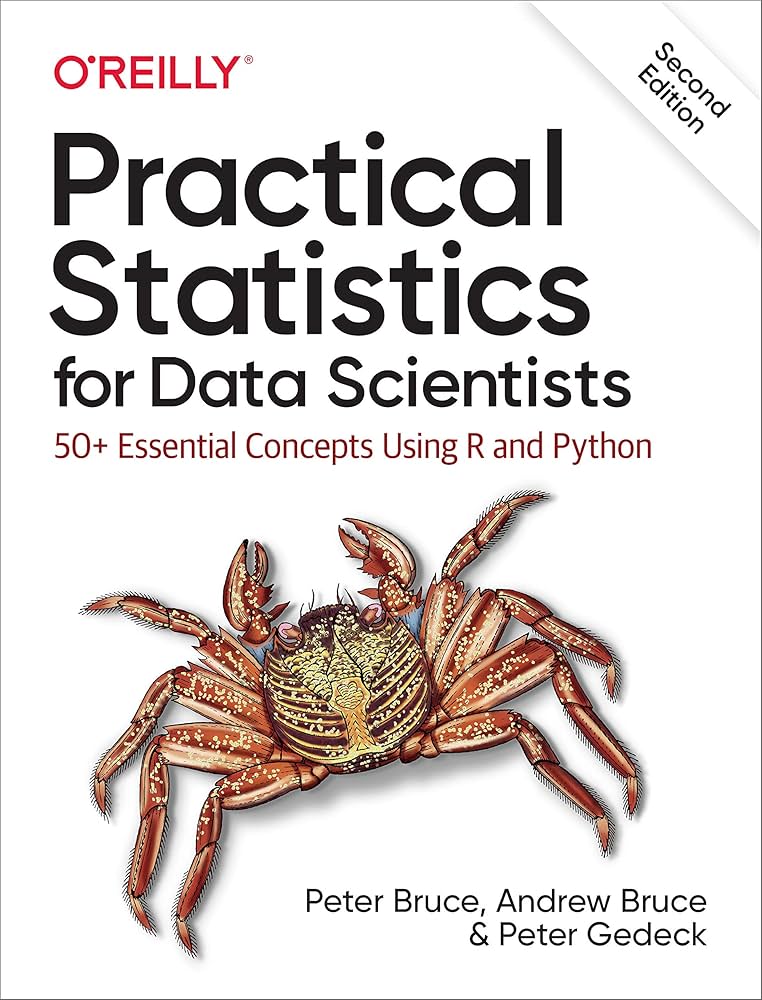
It is in that gap that <strong>Practical Statistics for Data Scientists</strong> emerges as a bridge — connecting learners to statistics in a practical, accessible way that directly supports real-world data analysis. Without overwhelming theory or lengthy formulas, this book goes straight to what a Data Scientist truly needs: understanding correctly, applying correctly, and effectively using more than 50 of the most essential statistical concepts.
If you want to solidify your statistical foundation, deeply understand what you are doing with data, or simply become more confident in modeling, analyzing, visualizing, or evaluating prediction quality — then this is the book you need to have on your desk.

1. Basic Information about the Book
Title: Practical Statistics for Data Scientists: 50+ Essential Concepts Using R and Python
Authors: Peter Bruce, Andrew Bruce, and Peter Gedeck
Publisher: O’Reilly Media
Main Content: Provides a modern, practical, and easy-to-apply statistical foundation for data science; helps readers correctly understand and correctly apply essential statistical concepts in analysis and model building.
Release Date: First edition: 2017 – Second edition (the most widely used): 2020
License: Commercial publication released by O’Reilly (PDF versions circulating online are typically digitized reference copies)
Page Count: Approximately 350+ pages depending on the edition
Highlights: Covers more than 50 core statistical concepts from a real-world Data Science perspective; illustrated using both R and Python, making it suitable for diverse audiences; focuses on meaning, application, and implementation instead of heavy formulas; each chapter includes examples, diagrams, sample code, and quick summaries; suitable for both self-learners and classroom teaching.
Practical Statistics for Data Scientists is not just a traditional statistics textbook. The book is designed to meet the learning needs of the data-driven era: learning by doing, learning quickly, learning through examples, and learning in a way that can be applied immediately to real-world projects.
2. Content Overview
The book Practical Statistics for Data Scientists covers more than 50 essential statistical concepts that anyone working with data needs to master. Each chapter is presented in a highly accessible way: clear explanations, intuitive examples, accompanying R/Python code, and real-world applications, allowing you to understand and apply the concepts immediately.
Chapter 1 – Exploratory Data Analysis (EDA)
This chapter serves as a “getting acquainted” stage with your data. You will learn how to inspect tabular data, classify different types of variables (continuous, discrete, categorical), and identify skewed data or outliers. Basic calculations such as mean, median, IQR, and MAD are explained through easy-to-understand examples. In addition, you will get familiar with histograms, boxplots, and density plots — essential tools for quickly understanding the structure of your data.
Chapter 2 – Data and Sampling Distributions
This chapter helps you understand why we can use a small sample to make inferences about an entire population. The authors explain concepts such as sampling, the Central Limit Theorem (CLT), and standard error in a very approachable way. This forms the foundation for building models and making reliable conclusions.
Chapter 3 – Statistical Experiments & Significance Testing
This chapter covers A/B testing, p-values, t-tests, chi-square tests, and other common statistical tests. The authors help you understand how to design experiments reliably, avoid biases, and, most importantly, interpret p-values correctly — something that many people often get wrong.
Chapter 4 – Regression & Prediction
If you’ve ever heard of “linear regression” but haven’t fully understood its essence, this chapter will clarify it for you. The authors discuss key assumptions, how to check residuals, multicollinearity, model evaluation methods, and more. Everything is illustrated with practical examples, making it easy to grasp.
Chapter 5 – Classification
At this point, you enter the world of classification, covering logistic regression, LDA, naïve Bayes, and more. Beyond the models, the book also guides you on evaluation metrics such as ROC curves, AUC, F1-score, and how to handle imbalanced data — issues frequently encountered in real-world applications.
Chapter 6 – Statistical Machine Learning
This is a section that many readers enjoy because the authors explain key concepts such as regularization, bias–variance tradeoff, as well as models like decision trees, random forests, and boosting. The clear presentation helps you understand “when to use each model” without being overwhelmed by theory.
Chapter 7 – Unsupervised Learning
This chapter covers clustering (k-means, hierarchical) and PCA. You’ll learn why data normalization is necessary, how to choose an appropriate number of clusters, and how PCA helps reduce noise and improve data visualization.
Summary:
Each chapter follows a very easy-to-follow flow: explanation → example → code → application → quick summary. This structure makes the book an extremely suitable resource for newcomers to data science or anyone who wants to reinforce their foundation in a gentle yet comprehensive way.
3. Who is This Book For?
The book Practical Statistics for Data Scientists is suitable for a wide range of readers, especially those looking to build a solid statistical foundation for data science.
Beginners in Data Science
This is the main target audience of the book. Statistical concepts are presented in an easy-to-understand manner, accompanied by practical examples, helping newcomers avoid being overwhelmed by theory or formulas.
Those familiar with Python or R who want to strengthen their statistics
If you are comfortable with pandas, NumPy, or scikit-learn but feel you lack the statistical foundation to truly understand how models work, this book will help fill that gap.
Students in Data, AI, or Mathematics – Statistics
The book’s content is presented in a practical, modern way that aligns closely with industry needs, making it ideal for supplementing or upgrading traditional academic knowledge.
Data Analysts looking to advance to Data Scientists
The book is especially useful if you struggle with concepts such as sampling, confidence, A/B testing, or model evaluation methods.
Marketing, Product, or Business Professionals
Even if you’re not a programmer, you can still grasp most of the book’s content. Concepts are explained with visual examples, helping you understand reports, evaluate data, and make more informed decisions.
Engineers and Developers Looking to Enter Machine Learning
For programmers aiming to transition into ML or AI, this book provides a foundational understanding of statistics, ensuring you grasp the core concepts before moving on to more advanced algorithms.
4. Why You Should Read This Book
There are many books on statistics, but Practical Statistics for Data Scientists stands out for its very practical approach, making it especially suitable for those working with data.
Avoids Getting Lost in Complex Mathematics
Instead of focusing on formulas, the book clearly explains what each concept is used for, when to apply it, when to avoid it, and common mistakes. Every section includes examples and R/Python code, helping you understand the essence and apply it correctly in practice.
Immediate Application to Work
All examples come from real-world problems such as population analysis, state-level data evaluation, regression modeling, or classification. As a result, the content is never dry and can be easily translated into practical skills.
Supports Both R and Python
A unique feature of the book is its parallel presentation of the two most popular languages in the data field, helping readers compare approaches and choose the most suitable tool.
Explanations True to the “Data Science” Spirit
The authors don’t just say “mean is the average”; they explain that the mean can be affected by outliers, why the IQR is better than the range for noisy data, and why MAD is often a more robust choice. Readers not only understand the concepts but also know how to apply them correctly.
Suitable for Interviews and Real-World Work
Almost every basic statistical question you might encounter in a Data Science interview—bias and variance, p-values, multicollinearity, overfitting, underfitting, or model evaluation—is clearly explained in the book.
Concise Yet Comprehensive
The book is compact but covers the entire core statistical foundation of Data Science, helping readers learn in a structured way rather than piecing knowledge together haphazardly.
5. Download and Experience
You can easily download or read this book online on various platforms such as SlideShare, Scribd, Issuu, or Studylid. Each platform supports direct reading, saving for later, and downloading when needed, making it convenient for both computers and mobile devices. Choose the platform that best fits your usage habits to fully enjoy the book’s content.
- Studylid: https://studylib.net/doc/27956323
- Slideshare (Part 1): https://www.slideshare.net/slideshow/practical-statistics-for-data-scientists-50-essential-concepts-using-r-and-python-part-1/284083302
- Slideshare (Part 2): https://www.slideshare.net/slideshow/practical-statistics-for-data-scientists-50-essential-concepts-using-r-and-python-part-2/284083341
6. References
[1] OpenStax, Introduction to Python Programming, OpenStax, Houston, TX, USA, 2023. Available: https://openstax.org/books/introduction-python-programming
[2] OpenDev, Foundations of Information Systems. Available: https://kienthucmo.com/en/foundations-of-information-systems/
[3] OpenDev, Introduction to Computer Science. Available: https://kienthucmo.com/en/introduction-to-computer-science/
[4] OpenDev, Principles of Data Science. Available: https://kienthucmo.com/en/principles-of-data-science/
[5] OpenDev, Workplace Software and Skills. Available: https://kienthucmo.com/en/workplace-software-and-skills/
[6]Python for Professionals: Learning Python as a Second. Available: Language: https://www.kobo.com/us/en/ebook/python-for-professionals-3
[7]Python: Deeper Insights into Machine Learning, Available:: https://www.kobo.com/us/en/ebook/python-deeper-insights-into-machine-learning
[8]DataFusion Python Bindings in Practice: The Complete Guide for Developers and Engineers, Available:: https://www.kobo.com/us/en/ebook/datafusion-python-bindings-in-practice


